
Virtual Reality and Analytics
September 8, 2016
The more we understand and experience virtual reality/augmented reality the more we think it will change industries. It has the potential to change retail and entertainment. Can you imagine watching a Packers game from any spot in the stadium? Amazing. Watching a football game on a pane of glass will feel like so yesterday.
It feels obvious that retail and entertainment will be disrupted. What about other industries? I would like to use some of these posts to process my thoughts around less obvious industries. This post is on analytics. I’ll write about both virtual reality and augmented reality.
Will analytics change with virtual reality and augmented reality?
I think so. But it’s not real obvious how. Let’s start with virtual reality. Right now analytics are often consumed via a dashboard. For example, if you’re looking at web traffic analytics, the dashboard could have hundreds of analytics including the number of unique visitors, country where they’re from, time spent on the site, where they came from, and many more. It’s often overwhelming.
Would a google analytics in VR make sense? How would it look? I think the big value for analytics in VR will be layers. In the above analytics I mentioned, country of origin could be one layer, time spent another, source of traffic another, number of visitors another. It would be like peeling a layer back from an onion.
How does this help provide deeper insights?
With this layered approach, I think you’ll be able to see new patterns. You could get in the middle of your data, literally. You could develop the VR app to help see these patterns and set visible alerts around trending valuable patterns. I think there is so much you could do but this would be a simple start.
What about augmented reality and analytics?
In the long run, augmented reality will replace much of what virtual reality does now. But what scenarios are possible right now?
What could be helpful are visual analytics. Imagine walking down a grocery aisle, looking at products, and seeing the sales of each product as you walk down the aisle. This would be a pretty simple analytics. Not sure how helpful this would be.
Another example is in a warehouse and visually seeing how many items are left in stock as you walk down the aisle.
Another example is taking analytics, lets’ say google analytics dashboards, and making them virtual using augmented reality. That way maybe you can see 5 screens at a time. This could be helpful for detecting trends. But still not as interesting as virtual reality.
I think that’s enough for now. The augmented reality examples bore me, so must be even more boring to you.
Related posts
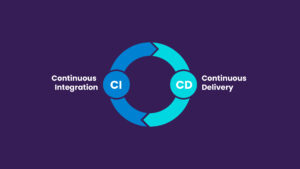
Curious about CI/CD… what it means and why you should care about it?
Augment’s got you covered! You may have heard the term “CI/CD” thrown around in software development discussions and internal meetings, but it’s not frequently discussed as to “why” it matters. CI/CD stands for Continuous Integration and Continuous Delivery (or Deployment, depending on the team). It is a set of practices that helps teams deliver code …

Introducing Auggy AI: A Conversational AI Assistant
Embracing AI sounds easy but it’s often hard to know what and how to implement AI. To that end, we built an internal custom AI assistant. Our AI assistant Auggy is built to respond accurately to questions regarding our internal policies, manage project tasks, and provide updates on JIRA, to create, and view events, allowing …

Why AI
Why are we excited about AI? There is definitely a lot of hype around AI. The hype is exciting but also deafening sometimes. Everyone feels the pressure to build and engage with AI. It’s magical, life changing. That’s kind of all true. But there is a lot of work to be done to achieve that …